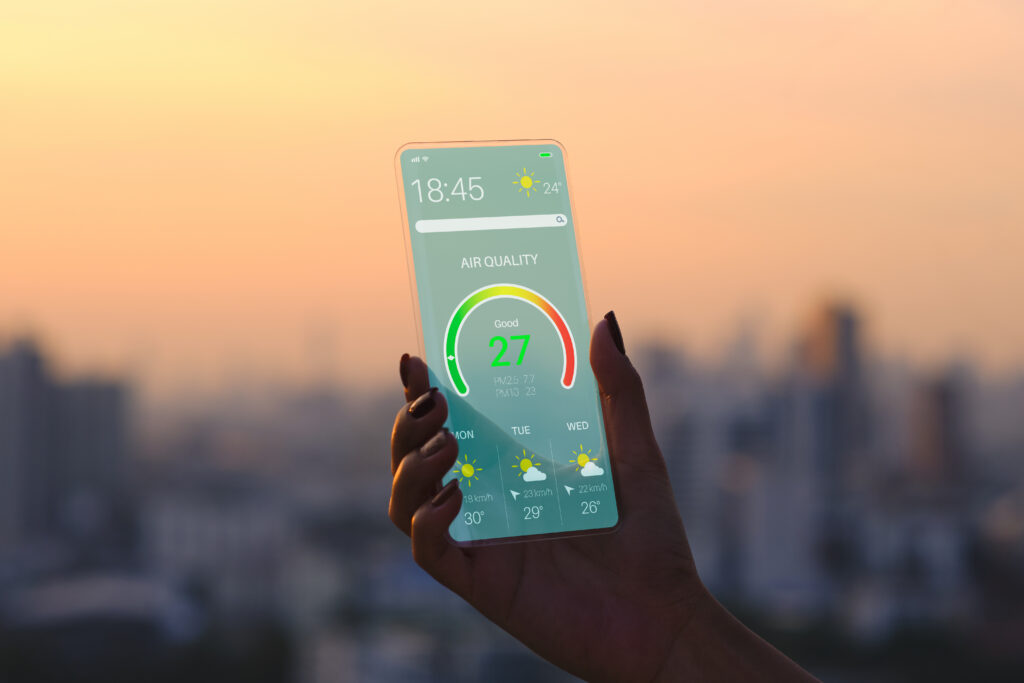
The Number in Your Weather App That Most People Don’t Understand
Air quality information has become standard in weather apps alongside temperature, humidity, and UV index — but unlike those metrics, most people have only a vague sense of what the Air Quality Index number actually represents, what it measures, and why it matters for their health. The AQI on a given day might be 45 or 145, and the difference between those numbers has real health implications, but the mechanism that produces them — and why summer produces the worst readings — is rarely explained.
Understanding air quality science makes the number more useful: it connects the forecast to specific pollutants with specific health effects, explains why certain weather conditions predictably produce high AQI days, and informs practical decisions about outdoor activity that go beyond simply staying inside when the number is high.
What the AQI Actually Measures
The Air Quality Index is not a single measurement — it is a standardized scale that converts measurements of five different air pollutants into a unified number on a scale of 0 to 500. The five pollutants are ground-level ozone, particulate matter (in two size categories), carbon monoxide, sulfur dioxide, and nitrogen dioxide. On any given day, the reported AQI is the highest of the individual pollutant indices — the pollutant causing the most concern determines the overall rating.
The scale is divided into six categories with color codes that most weather apps display: Green (0-50, Good), Yellow (51-100, Moderate), Orange (101-150, Unhealthy for Sensitive Groups), Red (151-200, Unhealthy), Purple (201-300, Very Unhealthy), and Maroon (301-500, Hazardous). Each color corresponds to specific health guidance — at Green, air quality poses little or no risk; at Red and above, everyone should reduce prolonged outdoor exertion.
In most of the United States on most summer days, the pollutant driving the AQI is either ground-level ozone or particulate matter — and each behaves very differently, forms through different processes, and is affected differently by weather.
Ground-Level Ozone: Summer’s Primary Pollutant
Ozone in the upper atmosphere — the stratospheric ozone layer — is beneficial, absorbing UV radiation. Ground-level ozone, by contrast, is a secondary pollutant — it is not emitted directly but forms through chemical reactions in the atmosphere. Specifically, ozone forms when nitrogen oxides (NOx) from vehicle exhaust and industrial emissions react with volatile organic compounds (VOCs) from vehicles, industry, and vegetation in the presence of sunlight and heat.
The formation chemistry is directly driven by temperature and sunlight intensity. Hot, sunny summer days accelerate the reactions that produce ozone, which is why ground-level ozone is primarily a summer problem and why the worst ozone days almost always occur on hot, sunny, stagnant weather days rather than on cool or cloudy days.
The meteorological conditions that produce the highest ozone concentrations are essentially the conditions everyone associates with a nice summer day: clear skies, low wind, high temperatures, and abundant sunlight. This is why ozone air quality warnings are counterintuitive to many people — they are issued on what looks like beautiful summer weather rather than on gray, polluted-looking days.
Wind is ozone’s enemy. Moving air disperses the precursor pollutants before they can complete the ozone-forming reactions and carries the resulting ozone away from population centers. Stagnant high-pressure systems — the same blocking patterns that produce heat waves — concentrate ozone precursors over urban areas and allow the photochemical reactions to proceed without dispersal. This is why air quality typically deteriorates during heat wave conditions and improves after frontal passages that bring wind and mixing.
The health effects of ozone exposure are primarily respiratory. Ozone is a highly reactive molecule that irritates and inflames the tissues of the respiratory tract, reducing lung function, triggering asthma attacks, causing chest tightness and coughing, and over time contributing to the development of chronic respiratory disease. Children, elderly people, and anyone with asthma, COPD, or other respiratory conditions are most vulnerable. Even healthy adults experience measurable reductions in lung function during outdoor exercise on high-ozone days.
Particulate Matter: The Other Major Summer Pollutant
Particulate matter — microscopic solid and liquid particles suspended in air — is the second major summer AQI pollutant and the one that has become more prominent in recent years due to wildfire smoke.
The EPA measures two size categories: PM10 (particles smaller than 10 micrometers in diameter) and PM2.5 (particles smaller than 2.5 micrometers — fine particulates). PM2.5 is the more health-relevant category because the smaller particles penetrate deeper into the respiratory system. Particles larger than 10 micrometers are typically filtered by the nose and throat. PM10 particles reach the bronchial tubes. PM2.5 particles penetrate to the deepest lung tissue and can cross into the bloodstream, contributing to cardiovascular disease, stroke, and systemic inflammation in addition to respiratory effects.
PM2.5 has two main sources in summer. The first is local combustion: vehicle exhaust, power plants, industrial processes, and wood burning all emit fine particles directly or emit precursors that form particles through atmospheric chemistry — similar to ozone formation. The second, increasingly prominent source is wildfire smoke.
Wildfire smoke is essentially a high-concentration PM2.5 event. The particles in smoke are the right size to penetrate deep into the lungs, and wildfire events can produce PM2.5 concentrations that dwarf what local emissions sources produce under normal conditions. The western United States has experienced severe smoke events in recent summers, but smoke transport on upper-level winds can carry wildfire particulates thousands of miles — producing orange-tinged skies and unhealthy air quality in the Midwest and Northeast from fires burning in Canada or the western states.
The combination of local ozone and transported wildfire smoke creates compound air quality events that are increasingly common in midsummer, when both ozone formation conditions and western wildfire activity peak simultaneously.
How Weather Determines Air Quality
The relationship between weather and air quality operates through several mechanisms that make the daily AQI forecast as weather-dependent as the temperature forecast.
Temperature directly drives ozone formation — higher temperatures accelerate photochemical reactions. Every degree of temperature above normal increases ozone production rates measurably. This is why ozone air quality is worst during heat waves: the same stagnant, hot conditions that elevate heat index values accelerate ozone chemistry above urban areas.
Wind speed and direction determine whether pollutants accumulate or disperse. Light winds allow ozone precursors and particulates to concentrate over the sources that produce them. Strong winds mix the atmosphere and carry pollutants away from population centers. Wind direction determines which way transported pollutants — including wildfire smoke — move: a southwest wind in Chicago may bring smoke from western fires, while a northwest wind brings cleaner Canadian air.
Atmospheric stability — the vertical mixing of the atmosphere — is the mechanism behind what air quality forecasters call mixing height or mixing depth. On days with strong surface heating and atmospheric instability, air near the surface rises and mixes with cleaner air aloft, diluting pollutants. On days with temperature inversions — which are common on calm summer nights and mornings — the stable layer traps pollutants near the surface where people breathe them. This is why air quality is often worst in the morning before the sun’s heating breaks down the overnight inversion, and why the first few hours after sunrise on a high-ozone day often show rapidly rising AQI values.
Precipitation is the most effective air quality cleaner — rain washes particulates from the atmosphere and provides the moisture that suppresses ozone formation. The post-rain air quality improvement that follows a summer thunderstorm is not imaginary: the Aitken nuclei that form cloud droplets include the same particulates that contribute to PM2.5, and rain scavenges them from the atmosphere as it falls.
Using the AQI Practically
For healthy adults, AQI values in the Green and Yellow categories require no behavioral adjustment. Orange days (101-150) warrant caution for sensitive groups — people with respiratory or cardiovascular disease, children, and elderly adults should reduce prolonged outdoor exertion, particularly during the afternoon ozone peak. Red days (above 151) call for all groups to reduce prolonged outdoor exertion.
For people with asthma or other respiratory conditions, the practical threshold for modifying outdoor activity is lower — Orange days may warrant the same caution that healthy adults apply on Red days. Discussing personal AQI action thresholds with a physician produces better-tailored guidance than general population recommendations.
The timing of outdoor activity matters on high-ozone days. Ozone concentrations peak in the afternoon — typically between 2 and 7 p.m. — when sunlight and heat have had the full day to drive photochemical reactions. Morning exercise, before the ozone peak develops, exposes people to lower concentrations than the same exercise in the afternoon. This is the same recommendation that the heat and exercise physiology piece made for cardiovascular reasons — morning activity is better than afternoon in summer for multiple converging reasons.
For wildfire smoke events, the AQI forecasts are less useful for anticipating the morning because smoke transport can shift rapidly with wind changes. Following real-time AQI monitoring apps — which update hourly from EPA monitoring stations — rather than the daily forecast is more useful during active smoke events when conditions can change within hours.
The Air You’re Breathing Right Now
The AQI number in your weather app represents the current or forecast concentration of the most concerning pollutant in the air at your location, translated into a color-coded health guidance scale. On a hot, sunny, stagnant July day, that number is most likely driven by ozone produced by the same beautiful weather that’s making the afternoon feel oppressive. On a hazy day with reduced visibility and an orange-tinged sky, it may be driven by wildfire smoke that began in forests a thousand miles away.
In either case, the number connects the weather outside your window to the air entering your lungs — a connection that becomes more relevant as summer progresses and the atmospheric conditions that produce poor air quality become more frequent and more intense.