The Worst Drought Since the 1950s
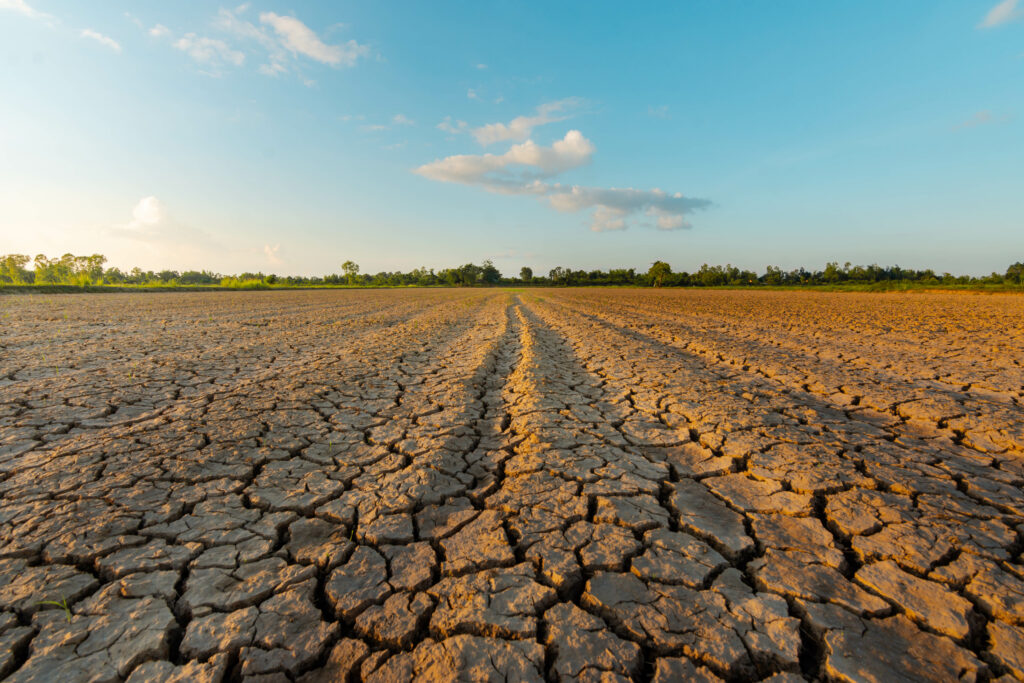
By July 2012, the United States Drought Monitor — the weekly map of drought conditions across the country covered in the drought science piece — showed something that hadn’t been seen in more than half a century: more than 60 percent of the contiguous United States in drought conditions simultaneously, with the most severe categories covering the heart of the nation’s agricultural belt. The corn and soybean crops of the Midwest and Great Plains, which had emerged from an unusually warm spring in excellent condition and with record production projections, were burning up in fields across Iowa, Illinois, Indiana, Nebraska, and Missouri.
The drought of 2012 produced the largest single-year agricultural loss in American history since the Dust Bowl era, drove commodity prices to levels that rippled through the global food system, and demonstrated with uncomfortable clarity how quickly the atmospheric conditions that support agricultural productivity can be withdrawn. It also arrived in a year that had already produced the warmest March on record across the United States, the second-largest wildfire season on record, and — as the derecho piece published recently covered — the most destructive straight-line wind event in American history. The summer of 2012 was an extraordinary compendium of weather extremes, and the drought was its most economically consequential chapter.
How the 2012 Drought Developed
The 2012 drought built through a combination of factors that the drought science piece described in their general form: precipitation deficits, elevated temperatures, and the self-reinforcing feedbacks that make droughts difficult to end once established.
The setup began in the fall and winter of 2011-2012, which delivered below-normal precipitation across much of the central United States. Soil moisture going into spring 2012 was already depleted in many areas — the buffer that normally allows crops to survive brief dry spells was reduced before the growing season began.
Spring 2012 was extraordinarily warm — the warmest March ever recorded in the contiguous United States at that point in history, followed by an equally warm April. The warm spring accelerated crop development and produced optimistic early-season projections, but it also accelerated soil moisture depletion. The corn crop emerged early and grew rapidly, but the warmth that drove that growth was consuming water at elevated rates in soils that were already dry.
When summer arrived with below-normal precipitation and above-normal temperatures across the central corn belt, the stage was set for rapid escalation. The soil moisture feedback described in the drought science piece operated at full force: dry soil eliminated evaporative cooling, surface temperatures rose dramatically above what moist soil would have produced, and the heat further stressed crops that were already struggling with inadequate water. The drought intensified explosively through June and into July — drought monitor categories that typically take weeks or months to deteriorate moved through multiple levels in single weekly updates.
What Corn and Soybean Farmers Experienced
The agricultural impact of the 2012 drought is best understood through what happened to corn — the United States’ largest crop and the foundation of a food system that produces everything from livestock feed to ethanol to high-fructose corn syrup.
Corn has a critical developmental stage called pollination, during which pollen must fall from the tassels at the top of the plant onto the silks emerging from the developing ear below. Pollination occurs over a period of roughly one to two weeks in midsummer, and heat and drought stress during this window are devastating — high temperatures kill pollen and dessicate silks, preventing fertilization and producing ears with few or no kernels.
In July 2012, the pollination window coincided almost perfectly with the drought’s peak intensity. Temperatures across the corn belt regularly exceeded 100°F during the critical pollination weeks. Fields that had looked promising in June — tall, dark green, with heavy tassels — emerged from the heat with barren, stunted ears that yielded a fraction of their potential. Farmers who had been planning record harvests were pulling sample ears from their fields and finding nothing inside.
The final corn harvest in 2012 fell approximately 13 percent below 2011 production — a massive shortfall for a crop whose production is measured in billions of bushels and whose price movements affect food costs globally. December corn futures — the contract that represents the expected value of the harvest — rose from around $5 per bushel in April to over $8 per bushel in August, the highest nominal price in the history of corn futures trading at that point.
Soybean impacts were similarly severe, though the soybean crop’s later critical period — pod filling in August rather than July — allowed some fields to partially recover when scattered rains arrived in late summer. The combined corn and soybean losses produced estimated agricultural economic damage of approximately $30 billion, making the 2012 drought the costliest agricultural disaster in American history.
The Drought’s Geographic Reach
What distinguished the 2012 drought from earlier severe droughts was not just its intensity in the core agricultural regions but its geographic scope. The Drought Monitor’s peak coverage — reached in mid-July 2012 — showed drought conditions in 65 percent of the contiguous United States, with the most extreme category (D4, Exceptional Drought) covering significant portions of Iowa, Illinois, Indiana, Missouri, Kansas, and Nebraska simultaneously.
This geographic extent meant that the normal market mechanisms that buffer regional crop failures — areas with adequate production compensating for areas with poor production — were largely unavailable. When drought reduces production in one region while other regions have normal or above-normal harvests, commodity prices adjust but the overall food system absorbs the shock. When drought covers the entire primary production region simultaneously, there is no buffering mechanism, and price and supply impacts are transmitted directly into the global food system.
The 2012 drought contributed to elevated global food prices in 2012 and 2013 — an impact felt most acutely in countries where food costs represent a higher fraction of household income than in the United States, and where corn and soybean-derived ingredients are food staples rather than primarily animal feed and industrial inputs as in the American diet.
The Livestock Cascade
Beyond the direct crop losses, the 2012 drought produced a livestock industry crisis that played out over subsequent years with its own distinct character.
Corn and soybeans are the primary feed inputs for beef, pork, and poultry production. When corn prices doubled in the summer of 2012, livestock producers faced a fundamental economic choice: continue feeding animals at doubled input costs with the resulting losses, or reduce herd sizes to cut costs. Many producers chose the latter, liquidating cattle herds and reducing hog and poultry operations. The liquidation of beef herds is a particularly significant decision because restoring a cattle herd takes years — cows must be bred, calves must be raised, and the full cycle from breeding decision to market beef takes two to three years.
The beef herd liquidation of 2012 drove cattle numbers to their lowest levels since the 1950s and produced the elevated beef prices that persisted through 2014 and 2015 as the herd slowly rebuilt. Consumers who wondered why ground beef prices remained elevated years after the drought ended were experiencing the multi-year livestock cascade that a single summer’s crop failure had set in motion.
Drought Monitoring and the Response Infrastructure
The 2012 drought tested the drought monitoring and response infrastructure that existed at the time and revealed both its strengths and limitations.
The Drought Monitor performed exactly as designed — providing weekly, publicly available, authoritative documentation of drought conditions that allowed agricultural lenders, commodity traders, government agencies, and farmers to make informed decisions based on consistent data. The USDA’s crop condition reports, published weekly during the growing season, tracked the deterioration of crop conditions in near-real-time and provided the information flow that allowed markets to price the emerging supply shortage efficiently — if painfully.
Federal crop insurance — which had been substantially expanded in the decades before 2012 — provided a financial safety net for most commercial producers, with total crop insurance indemnities in 2012 reaching approximately $17 billion, the highest single-year total in the program’s history at that point. The insurance program prevented widespread farm failures of the kind that characterized the Dust Bowl era, when no such safety net existed.
What the response infrastructure could not do was end the drought or prevent the crop losses — it could only document, price, and partially compensate them. The 2012 drought ended as droughts do: not through any intervention but through the return of more favorable atmospheric circulation patterns in the fall, bringing the precipitation that allowed soil moisture to partially recover before the 2013 growing season.
The Season That Keeps Providing Context
The 2012 drought remains the modern benchmark for American agricultural drought — the event against which subsequent dry years are measured and the case study that drought researchers, agricultural economists, and climate scientists return to repeatedly. It demonstrated the speed with which drought can escalate in the self-reinforcing feedback framework described in the drought science piece, the scale of economic disruption that a single bad growing season can produce, and the global reach of disruptions to American agricultural output.
As the summer of 2026 advances and the Drought Monitor’s weekly map is updated each Thursday, the 2012 pattern is the reference point for what the most extreme outcome looks like. Most summers are not 2012. The atmospheric conditions that produced it — the warm winter, the early spring, the persistent summer blocking pattern — can and do reassemble themselves. The agricultural system is better prepared to document and financially buffer the impact than it was in 1936 or 1956. It remains as exposed to the fundamental vulnerability as it has always been.