The Season You’re Experiencing Is Different From the One Your Parents Knew
Spring feels different than it used to. That instinct, widely reported across generations and regions, turns out to be correct — and measurable. Decades of phenological records, temperature data, pollen monitoring, and storm tracking document changes in how spring arrives, how long it lasts, and what it brings. These changes are subtle enough that any single year can look normal, but the trends across decades are clear and consistent.
Earth Day, observed each April 22 since 1970, was created in response to growing awareness of how human activity was altering natural systems. More than fifty years later, those alterations are visible in the season we’re currently living through. Understanding what the data actually shows — without overstating or understating it — is one of the more grounding ways to observe the day.
Springs Are Arriving Earlier
The most consistently documented change in spring across North America is its earlier arrival, measured by the biological indicators that have tracked seasonal change for centuries.
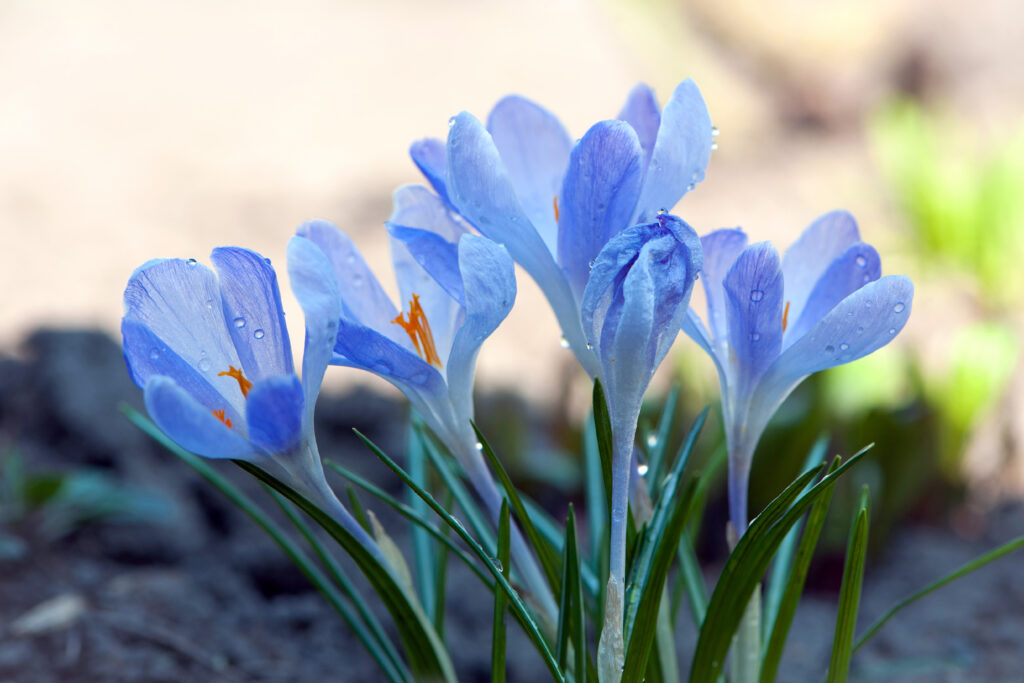
Lilac first bloom dates — recorded by volunteer observers across the United States and Canada since the 1950s — have shifted earlier by an average of several days across most of the country, with some regions showing advances of one to two weeks compared to mid-20th century baselines. Cherry blossom peak bloom in Washington D.C., tracked since 1921, has shifted earlier by roughly five to ten days over the past century, with the most pronounced advancement occurring in recent decades.
Bird migration timing has shifted correspondingly. Ruby-throated hummingbirds, barn swallows, and dozens of other neotropical migrants are arriving at their breeding grounds earlier than historical averages. Tree leaf-out dates — when deciduous trees first produce leaves in spring — have advanced by several days across much of the eastern United States since systematic records began.
These biological indicators are responding to the underlying physical change: spring temperatures are arriving earlier. The date on which daily temperatures first consistently exceed various thresholds — the last freeze date, the date of first 50°F soil temperature, the date of first 60°F average temperatures — has shifted earlier across most of the country, with the largest advances in the West and Upper Midwest.
Frost Seasons Are Shortening
The freeze-free growing season — the period between the last spring frost and the first fall frost — has lengthened measurably across most of the United States over the past several decades. The change is driven by both earlier last spring frosts and later first fall frosts, with the spring end of the equation showing the larger shift in most regions.
Since 1991, the average last spring freeze date across the contiguous United States has moved roughly one to two weeks earlier compared to the 1901 to 1960 baseline, though the change varies considerably by region and elevation. Parts of the Southwest and West have seen particularly large shifts, while some regions of the Southeast and northern Plains show more modest changes.
For gardeners, this shows up as frost date charts that feel slightly out of date. Many gardeners in Zone 5 and 6 who were told their last frost date was May 10 or May 15 are finding that practical experience suggests mid-April is now more appropriate — and the updated USDA Plant Hardiness Zone maps, last revised in 2023, reflect these shifts with many locations moved to warmer zones compared to the previous 1990 map.
Pollen Seasons Are Getting Longer and More Intense
The spring allergy season — already covered in this series as a weather-driven phenomenon — is itself changing in measurable ways that have direct health implications.
Pollen monitoring data collected across North America since the 1990s shows that pollen seasons have lengthened by an average of roughly 20 days since 1990, with the extension occurring primarily at the beginning of the season — earlier start dates driven by earlier spring warmth. Total seasonal pollen loads have also increased in many regions, reflecting both the longer season and increased pollen production per plant in response to elevated carbon dioxide concentrations, which function as a fertilizer for vegetation.
Ragweed season — technically a late summer and fall phenomenon but connected to the same pattern — has extended by up to 25 days in northern regions compared to 1995 baselines. The combined effect on allergy sufferers is a longer annual exposure window, higher peak concentrations, and reduced shoulder periods between major pollen seasons.
The connection between warmer springs and worse allergy seasons, covered in the Weather Daily piece on spring allergies, is not just a year-to-year weather relationship — it’s a long-term trend that is making the average allergy season worse than the one allergy sufferers managed a generation ago.
Spring Precipitation Patterns Are Shifting
Precipitation changes are more complex and regionally variable than temperature changes, but several consistent patterns have emerged from long-term data.
Across much of the eastern United States, total spring precipitation has increased modestly, but the distribution has shifted — more precipitation falling in heavy events and less in moderate, steady rainfall. This pattern, sometimes described as “feast or famine” precipitation, means more flash flood risk from intense events interspersed with longer dry periods between them.
The intensity of spring rainfall events has increased across much of the country, consistent with the thermodynamic expectation that a warmer atmosphere holds more moisture and releases it in more concentrated bursts. Heavy precipitation events — those exceeding one inch in 24 hours — have become more frequent across the Midwest and Northeast.
The implications for spring flooding are direct: more intense precipitation events falling on already-stressed watersheds produce higher and faster-rising flood crests. The spring flooding science covered earlier in this series describes how the system works; the changing precipitation patterns describe how the inputs to that system are shifting.
Severe Weather Season Is Expanding
The relationship between climate change and tornado frequency is one of the more scientifically contested areas in meteorology — the data record for tornadoes is complicated by changes in detection capability over time, making historical comparisons difficult. What is clearer is that the geographic range and seasonal timing of severe weather are shifting.
Tornado activity has shown a statistical shift eastward in recent decades, with the traditional Tornado Alley states of Kansas and Oklahoma showing relatively flat or slightly declining frequency while the Southeast — sometimes called Dixie Alley — has seen increased tornado activity. This shift has significant safety implications because the Southeast has higher population density in rural areas, more mobile housing, more tree cover that obscures visual warning, and a higher proportion of nighttime tornadoes than the traditional Great Plains tornado belt.
Severe weather events — including tornadoes, large hail, and damaging winds — are also occurring earlier in the calendar year than historical norms in many regions, extending what was already a significant spring severe weather season. February and March are now producing significant outbreak events that were historically uncommon in those months.
What Staying Observant Looks Like
The changes documented above are happening at a pace that makes them invisible within any single year but unmistakable across a decade or two of careful observation. The gardener who has kept planting records for twenty years notices that the frost date that used to reliably govern their schedule no longer does. The allergy sufferer who has managed their symptoms for a decade notices that the season starts earlier and lasts longer than it used to. The birdwatcher who has kept arrival date logs notices the hummingbirds coming back earlier.
These observations, multiplied across millions of people who pay close attention to the natural world, constitute a kind of distributed monitoring network that complements the formal scientific record. Earth Day began as a call to pay attention to what was happening to the natural systems we depend on. Fifty years later, paying attention remains both the beginning of understanding and its own form of engagement with the world the season offers.
Spring is still spring. It’s also measurably, documentably different from the spring of fifty years ago — arriving earlier, lasting longer, bringing more intense rain, a longer allergy season, and a gradually shifting biological calendar. Knowing that doesn’t diminish the season. It makes it more interesting to watch.